1
2
3
4
5
6
7
8
9
10
11
12
13
14
15
16
17
18
19
20
21
22
23
24
25
26
27
28
29
30
31
32
33
34
35
36
37
38
39
40
41
42
43
44
45
46
47
48
49
50
51
52
53
54
55
56
57
58
59
60
61
62
63
64
65
66
67
68
69
70
71
| import numpy as np
import matplotlib.pyplot as plt
import seaborn as sns
from scipy import signal
image = -1 * np.ones((9, 9), dtype=int)
np.fill_diagonal(image, 1)
np.fill_diagonal(np.fliplr(image), 1)
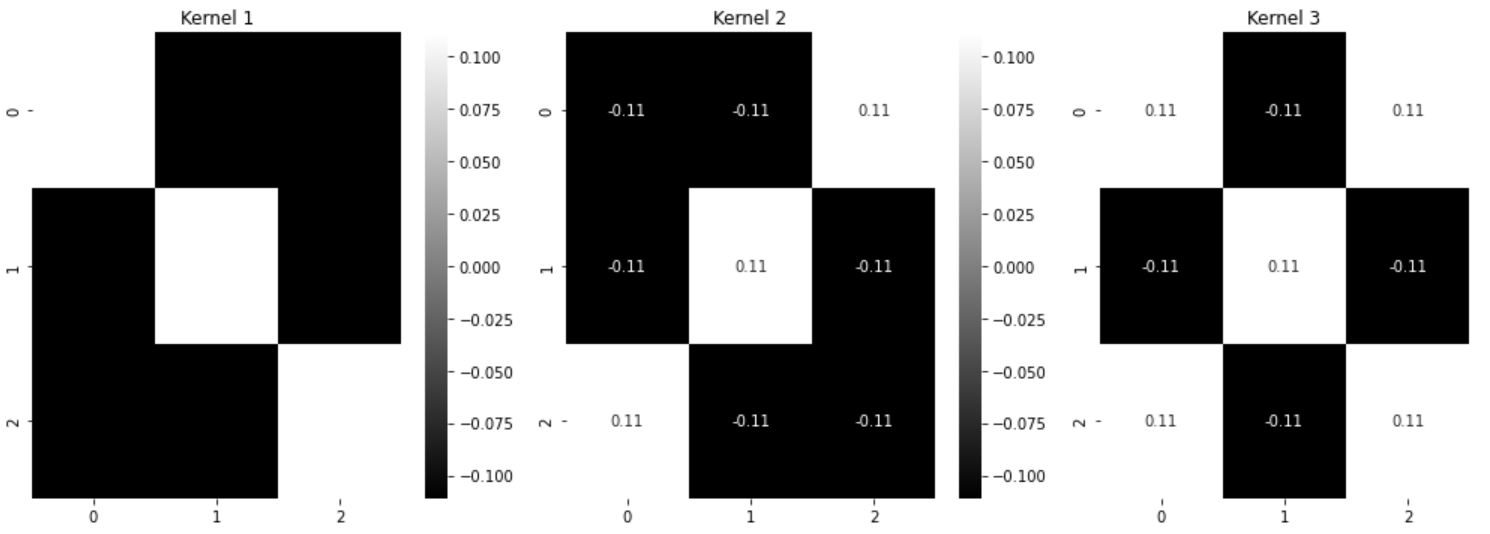
kernel1 = np.array([
[1, -1, -1],
[-1, 1, -1],
[-1, -1, 1]
]) /9
kernel2 = np.array([
[-1, -1, 1],
[-1, 1, -1],
[1, -1, -1]
]) /9
kernel3 = np.array([
[1, -1, 1],
[-1, 1, -1],
[1, -1, 1]
])/9
kernel4 = np.array([
[0, -1, 0],
[-1, 1, -1],
[0, -1, 0]
]) /9
kernel5 = np.array([
[1, 1, 1],
[1, 1, 1],
[1, 1, 1]
]) / 9
conv_image1 = signal.convolve2d(image, kernel1, mode='same')
conv_image2 = signal.convolve2d(image, kernel2, mode='same')
conv_image3 = signal.convolve2d(image, kernel3, mode='same')
fig, axarr = plt.subplots(1, 4, figsize=(20, 5))
sns.heatmap(image, ax=axarr[0], annot=True, cmap='gray')
axarr[0].set_title("Original Image")
sns.heatmap(conv_image1, ax=axarr[1], annot=True, cmap='gray')
axarr[1].set_title("Convolved with Kernel 1")
sns.heatmap(conv_image2, ax=axarr[2], annot=True, cmap='gray')
axarr[2].set_title("Convolved with Kernel 2")
sns.heatmap(conv_image3, ax=axarr[3], annot=True, cmap='gray')
axarr[3].set_title("Convolved with Kernel 3")
plt.tight_layout()
plt.show()
|

